Screening 13F filings for what institutions actually bought
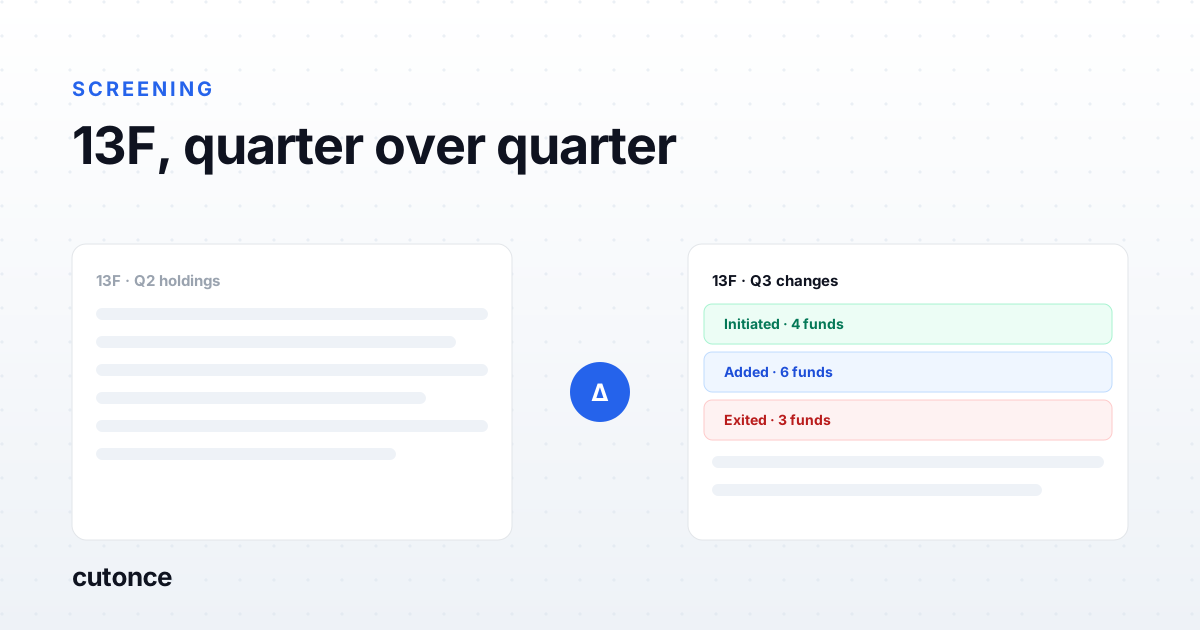
- A 13F on its own tells you little. The information is in the quarter-over-quarter change: new positions, adds, trims, and exits. A holdings list without the prior quarter next to it is a snapshot with no direction.
- The strongest institutional signal is a cluster: several high-conviction managers initiating or adding the same name in the same quarter, which is far more informative than any single fund's position.
- Four limitations are built into the filing and have to be handled, not ignored: a 45-day reporting lag, longs-only disclosure, a quarter-end snapshot that hides round trips, and no cost basis.
- By hand you can track a few managers. At scale you diff every filing in a chosen set against its prior quarter and aggregate by ticker, which is the only way consensus buying and new initiations surface across the whole group.
Every quarter a wave of 13F filings lands, and every quarter the coverage reads the same way: here is what a famous investor bought. It is the wrong unit of analysis. A single manager's holdings list, read on its own, is a snapshot with the direction stripped out - you see that they own a name, not whether they just bought it, have held it for six years, or spent the quarter quietly selling it down. The information in a 13F is almost entirely in the change from last quarter, and the strongest version of that signal only shows up when you look across many funds at once. Here is how to actually screen it.
Why the change matters more than the level
A holdings list answers "where is this manager now." The more useful question is "what did they decide this quarter," and that is a diff, not a level. A position a fund has held for years might be a legacy holding nobody on the desk has revisited. A brand-new initiation, or a position they doubled, is an active decision made with current information. Those two things sit side by side in the same filing looking identical until you put the prior quarter next to it and classify each line: initiated, added, trimmed, exited, unchanged.
This is the same principle that makes insider filings worth reading - the event is the transaction, not the resulting balance. It is the institutional cousin of the retail-facing signal in the cluster insider-buying signal, and the two are worth watching together: insiders and institutions buying the same name in the same window is a more specific thing than either alone.
The real signal: clustering across managers
One fund initiating a position is one fund's opinion. Several high-conviction managers initiating or adding the same name in the same quarter is a different object entirely - a cluster. Clustering is what turns 13F data from gossip into a screen, because it filters out the idiosyncratic (one manager's pet thesis, or a position taken for reasons you cannot see, like a merger arb leg) and surfaces names that independent, well-resourced desks arrived at separately.
The flip side is just as useful: a name several respected funds all trimmed or exited in the same quarter. Consensus selling among managers who had conviction enough to be there in the first place is a prompt to re-examine a thesis, not a verdict, but it is a prompt you would never assemble by reading filings one at a time.
The four limitations you cannot ignore
13F data has four blind spots built into the rules, and every one of them has burned someone who treated the filing as a live portfolio feed:
| Limitation | What it means |
|---|---|
| 45-day lag | Filed up to 45 days after quarter end, so by the time you read it the position is up to a quarter and a half old. The manager may have already reversed it. |
| Longs only | 13Fs disclose long positions in 13(f) securities. Shorts, and the hedges that define a book's actual exposure, are invisible. A long you are excited about may be one leg of a pair. |
| Quarter-end snapshot | Only the position on the last day of the quarter is reported. A name bought and sold within the quarter never appears, so the filing understates real activity. |
| No cost basis | You see the share count, not what they paid. You cannot tell whether a manager is sitting on a gain or a loss, which changes what a "hold" even means. |
None of these makes 13F data useless. They make it a source of leads to investigate rather than signals to act on. The correct posture is to use the clustering to narrow a universe down to names worth a real look, then do the real look.
The workflow at scale
Turning this into a screen is four steps, and the whole thing hinges on doing the diff uniformly:
- Acquire. Pull the 13F filings for the set of managers you care about - a curated list of high-conviction funds, or a broader group - keyed to manager and quarter.
- Parse. Turn each filing into per-ticker positions with share counts and reported value, normalized so the same security lines up across managers and quarters.
- Diff.Compare each manager's filing against their own prior-quarter filing and classify every holding: initiated, added, trimmed, exited, unchanged. This is where the direction comes from.
- Aggregate by ticker. Roll the per-manager changes up to the name, so you can see how many funds in the group initiated or added a given ticker this quarter, and rank the universe by that net activity.
The output that pays off is a ranked table: names sorted by how many managers in your set were buying, with the exits alongside, so consensus accumulation and consensus distribution are both visible at a glance. That is a screen you can run in an afternoon and could never assemble by hand across more than a handful of funds.
Do not backtest it naively
13F data is a favorite input for "follow the smart money" backtests, and most of those backtests are wrong for a specific reason: the 45-day lag and the quarter-end snapshot mean the data you would have actually had at the time is not the data most backtests use. It is very easy to build a strategy that looks like it front-ran institutional buying when in fact it used positions that were not disclosed until weeks after the prices you are testing against. The general version of this trap - a screen that beats the benchmark on paper and underperforms live - is covered in why backtested screens fail live, and 13F data is one of the easiest places to fall into it. Use point-in-time filing dates, not quarter-end dates, if you test anything.
Running it as a pipeline
In Cutonce this is a saved pipeline: a filings node pulls the 13Fs for your chosen managers from EDGAR, a step diffs each against the prior quarter and classifies every position, and an aggregation groups the changes by ticker into a ranked table you can send to a sheet or a Slack channel. Because it is saved, next quarter's filings run through the same logic automatically, and the new initiations and consensus adds surface without re-reading a single filing. It pairs naturally with insider data, where the same accumulation shows up from a different angle - the Form 4 side of that is in the Form 4 transaction codes reference.
The point is not that a machine decides what the institutions think. It is that the diffing and aggregating - the mechanical part that makes the signal visible - stops being a quarterly slog, so your attention goes to the ten names the cluster flagged instead of to reconciling spreadsheets.
Note: this is not investment advice. 13F output is a stale, longs-only, quarter-end lead, not a live portfolio, and copying institutional positions blindly ignores everything the filing does not show. Verify any name against current filings and your own work before acting on it.
Frequently asked
What is a 13F filing and what does it disclose? Form 13F is a quarterly report that institutional investment managers with over $100 million in US-listed equity assets must file with the SEC, due within 45 days of quarter end. It discloses their long positions in 13(f) securities - mostly US-listed stocks and some options and convertibles - as a snapshot at the quarter-end date. It does not disclose short positions, cash, non-US holdings, or cost basis, and managers can apply for confidential treatment to delay disclosure of some positions.
Why track changes in 13F holdings rather than the holdings themselves? Because the level tells you where a manager already was, and the change tells you what they decided this quarter. A large existing position may be a legacy holding they have stopped thinking about; a brand-new initiation or a position they doubled is an active decision. Diffing each filing against the prior quarter turns a static holdings list into a stream of decisions - initiated, added, trimmed, exited - which is the part with information in it.
What are the main limitations of using 13F data? Four. The 45-day lag means the data is up to a quarter and a half stale by the time you read it. It is longs-only, so it shows a manager's book with the hedges and shorts removed. It is a quarter-end snapshot, so a position opened and closed within the quarter never appears. And there is no cost basis, so you cannot tell whether a manager is up or down on a name. Treat 13F output as a lead to investigate, never as a real-time or complete picture.
How do you screen 13F filings across many funds at once? Pull the 13F filings for a chosen set of managers, parse each one into per-ticker positions, diff every filing against the same manager's prior-quarter filing to classify each holding as initiated, added, trimmed, or exited, then aggregate those changes by ticker across the whole group. The output is a ranked list of names by net institutional activity - the consensus buys and sells - which is what makes a fund-by-fund exercise into a screen.