How to analyze every bank's earnings call in a quarter
- An entire industry is the ideal unit for reading at scale when its companies report on the same metrics. Banks are the clearest case: every one talks about net interest margin, deposits, loan growth, credit quality, and capital, so a single fixed extraction makes them directly comparable.
- The value is the cross-section. Reading one bank's call tells you about one bank; reading all of them the same way tells you whether a credit-quality worry is sector-wide or idiosyncratic - which is usually the first question worth asking.
- The output is a table, not a stack of summaries: one row per bank, the same columns for every one (NIM direction, deposit trend, provision build or release, capital return, guidance tone), sortable and rankable.
- The pattern is not specific to banking. Swap the field set and the same workflow reads every energy producer, every semiconductor maker, or every REIT - any industry where the companies report on a common vocabulary.
To analyze an entire industry's earnings calls at once, run one fixed extraction across every company's call and assemble the results into a single comparable table. Banking is the ideal example, because every bank reports on the same levers - net interest margin, deposits, loan growth, credit quality, and capital - so one report can read the whole group and rank it. Here is the workflow, and why the industry, not the single company, is the right unit.
In the two weeks when the banks report, an analyst covering the group faces the same impossible arithmetic as everyone else: thirty, forty, fifty calls, all landing in a compressed window, each an hour long. The usual answer is triage - read the four or five biggest, skim a few more, and form a sector view from a sample. Banking is the industry where that trade is least necessary, because banks are unusually easy to read at scale: they all report in the same vocabulary, so one fixed extraction runs across every call and becomes a table you can sort.
Why read an entire industry's earnings calls at once?
Reading at scale pays off most when the things you extract are comparable, and comparability is highest inside a single industry. Banks are the extreme case: every one of them talks about net interest margin, deposit trends, loan growth, credit quality, and capital return, because those are the levers of the business. That shared vocabulary is what makes the whole group a single dataset. Ask every bank the same questions and the answers line up in columns, which is exactly the property that lets you rank forty of them instead of reading five. The general mechanics of asking every call the same question are in analyzing earnings call transcripts at scale; banking is where it works best.
What should you extract from a bank's earnings call?
Decide the columns before the run. For a bank, a workable set:
| Field | What you are extracting |
|---|---|
| Net interest margin | Direction this quarter and the guidance - expanding, stable, or compressing. |
| Deposits | Growth or outflows, deposit beta, and any mix shift toward higher-cost time deposits. |
| Loan growth | By category - commercial, consumer, real estate - and management's appetite. |
| Credit quality | Provision build or release, net charge-offs, non-performing assets, reserve commentary, and any flag on commercial real estate or consumer. |
| Capital return | Buybacks, dividend actions, and the CET1 ratio. |
| Guidance tone | How firmly the outlook is committed to, and whether it changed from last quarter. |
Credit quality is the field to be strictest about, because it is where the cycle turns and where the language moves before the numbers do. A bank that starts talking more about commercial real estate, or quietly rebuilds reserves after several quarters of releasing them, is worth catching early.
The output is a table, not a pile of summaries
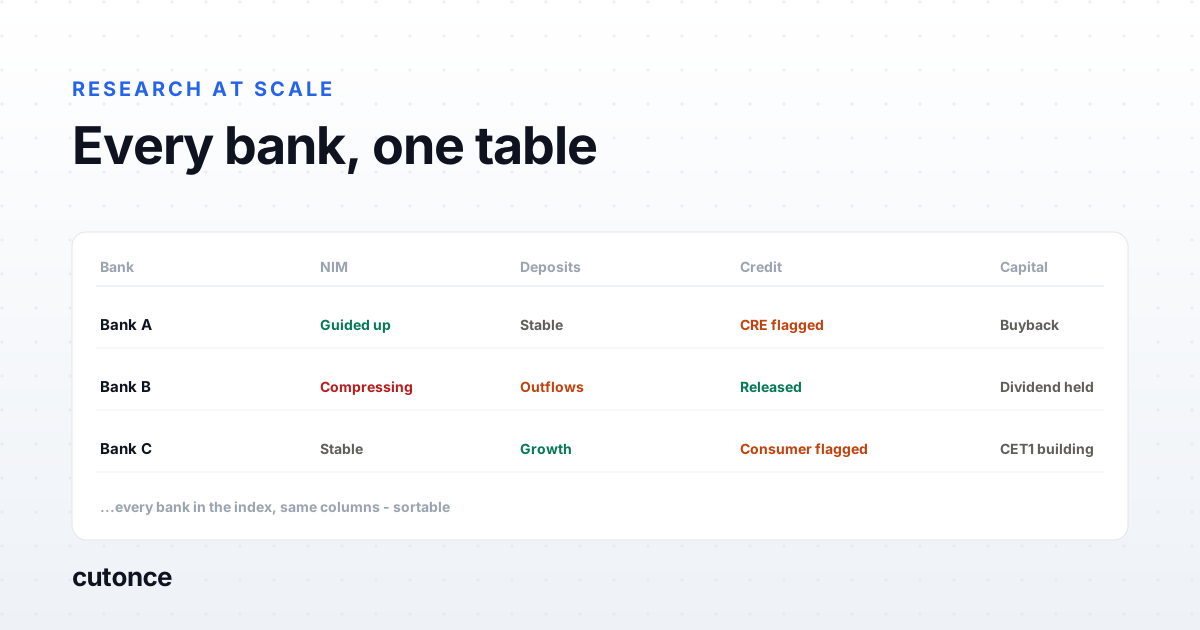
Run that extraction across the industry and the result is one row per bank with the same columns for every one - which is what makes it useful. Here is the shape of the output (illustrative, with placeholder names - not real results):
| Bank | NIM | Deposits | Credit | Capital |
|---|---|---|---|---|
| Bank A | Guided up | Stable, low beta | Reserves built, CRE flagged | Buyback resumed |
| Bank B | Compressing | Outflows, mix shift | Reserves released | Dividend held |
| Bank C | Stable | Growth, higher beta | Charge-offs up, consumer flagged | CET1 building |
That is a research artifact you can act on: sort by NIM guidance to see who expects margin relief, filter to the banks building CRE reserves, or rank by how far credit commentary deteriorated versus last quarter. None of that is possible from a stack of one-paragraph call summaries.
The cross-section is the whole point
With every bank in the same table, the questions that actually matter become answerable, and they are all relative. Is the credit-quality caution this quarter a sector-wide turn or one management team being conservative? Did deposit betas rise across the board, or only at the banks without sticky retail funding? Is one bank guiding margin up while its peers guide down, and if so, why? A single call cannot answer any of these; the group, read uniformly, answers all of them. The outliers - the one bank saying something different from the other thirty-nine - are usually the most interesting rows, and they only stand out against the cross-section.
Read the management, not just the metrics
The numbers are half of it. How each management team talks about credit - whether they answer the analyst questions on office exposure or deflect them, whether the reserve commentary is specific or hand-wavy - is its own signal, and it is comparable across the group too. That is the industry-scale version of the management-quality read, and in a sector where confidence and credibility move stocks, running it across every bank at once is a real edge. Where the spoken commentary and the actual filing disagree is worth a second look, which is the call-versus-filing cross-check pointed at one industry.
Does this work for industries other than banking?
Nothing here is specific to banks except the field list. The workflow - pull every transcript in the group, run one fixed extraction, assemble a comparable table - applies to any industry whose companies report on a shared vocabulary. Swap the columns and you have the same report for a different sector:
- Energy producers: production, realized prices, capex, hedging, and breakeven.
- Semiconductors: bookings, backlog, inventory, lead times, and utilization.
- REITs: FFO and AFFO, occupancy, lease spreads, and cap rates.
- Consumer: comparable sales, traffic versus ticket, promotion, and inventory.
Build the extraction once for an industry and it reads that whole industry every quarter, on a schedule.
Running it as a pipeline
In Cutonce this is a saved pipeline: set the universe to the industry - every bank in the index or on your list - a transcript node pulls all their calls, an AI node runs the fixed field extraction over every one, and the output lands as a comparable table in a sheet or Slack, with the source quote behind each field. Because it is saved, next quarter is a rerun, and the results line up against the last one so you can watch NIM guidance and credit commentary move across the whole industry over time.
That is the real advantage in one sentence: not reading a bank faster, but reading the entire industry the same way, every quarter, and getting a table you can sort - the work of a research team, run before the market opens.
Note: this is not investment advice, and the example output above is illustrative, not a real analysis of any specific bank. Reading at scale produces a comparable shortlist to investigate, not a conclusion, and models misread transcripts - keep the source quote next to every field and verify anything you act on against the company's own transcript and filings.
Frequently asked
How do you analyze an entire industry's earnings calls at once? Pull the transcripts for every company in the industry, run one fixed extraction over all of them so each returns the same fields, then assemble the results into a single comparable table. Banking is the ideal example because every bank reports on the same handful of themes - net interest margin, deposits, loan growth, credit quality, and capital - so the extracted fields line up cleanly and you can sort the whole group by any of them.
What should you extract from a bank's earnings call? A fixed set of comparable fields: net interest margin direction and guidance, deposit trends (growth or outflows, deposit beta, mix shift toward time deposits), loan growth by category, credit quality (provision build or release, net charge-offs, non-performing assets, reserve commentary, and any flags on commercial real estate or consumer), and capital return (buybacks, dividend, CET1). Defining that field list before the run is what makes the calls comparable across the whole industry.
Why read the whole industry instead of a few banks? Because the most useful signal is relative. If one bank builds credit reserves, that is one data point; if every bank builds reserves this quarter, that is a sector-wide read on where credit is heading, and if only one does, that is an idiosyncratic flag worth investigating. You cannot see either pattern from a handful of names - it only appears when you read the whole group the same way and put the results side by side.
Does this only work for banks? No. Banking is the cleanest example because the reporting vocabulary is so standardized, but the same workflow applies to any industry whose companies discuss a common set of metrics. For energy producers you extract production, realized prices, capex, and hedging; for semiconductors, bookings, inventory, and lead times; for REITs, FFO, occupancy, and cap rates. Same pipeline, different field list.