How to analyze earnings call transcripts at scale
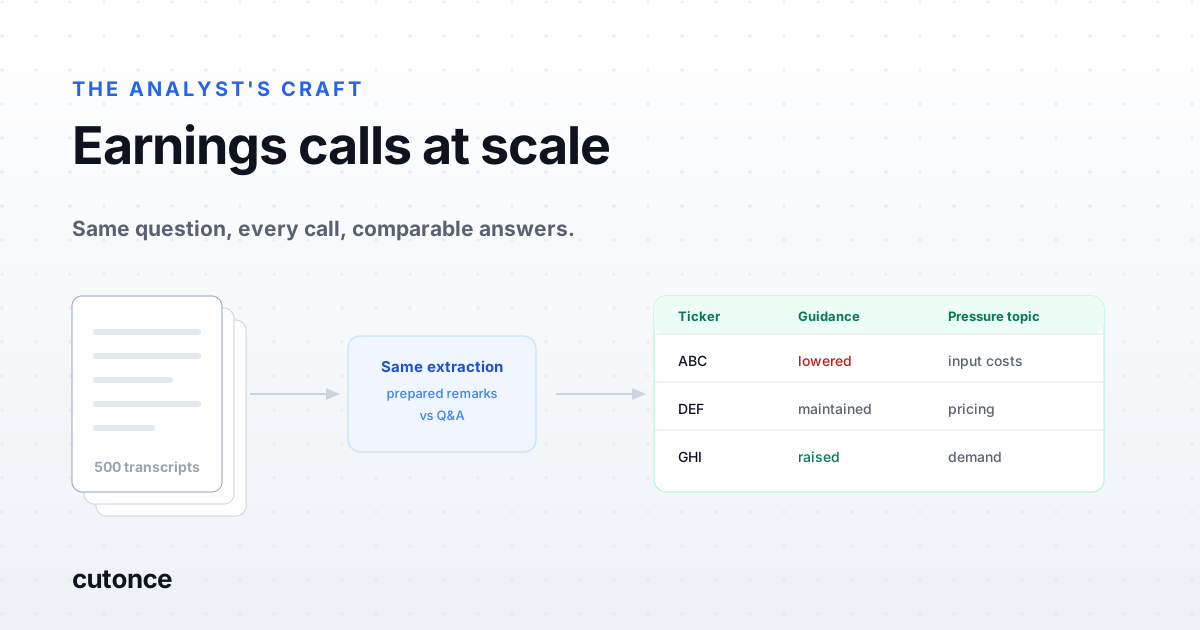
- Analyzing calls at scale is not a reading problem, it is a comparability problem. The value comes from asking every call the same question and getting answers in the same shape, so you can rank and diff them.
- The workflow is four steps: acquire transcripts for the whole universe, split each call into prepared remarks and Q&A, extract a fixed set of fields from each part, then compare across companies and across quarters.
- Prepared remarks and Q&A should be scored separately. Prepared remarks are drafted and reviewed; Q&A is not. The gap between the two is usually where the signal is.
- Freeform summaries do not scale. If the output of each call is a paragraph, you have made 500 paragraphs and no dataset. Fixed fields with defined values are what make the run reviewable.
Reading one earnings call well is not hard. You know what to look for: what changed in the guidance, which questions the CFO did not really answer, where the language got vaguer than last quarter. The hard part is doing that across every name you cover, in the two weeks when they all report, the same way each time. Most analysts solve this by triaging - read the ten that matter most, skim the rest, miss whatever was in the ones you skipped. Analyzing calls at scale means not having to make that trade. Here is what the workflow actually looks like.
Why scale is a comparability problem, not a reading problem
The instinct is to treat this as a volume problem: 500 calls, too many hours, get something to read faster. That framing leads to summarization, and summarization is the wrong output. If you generate a paragraph per call you have produced 500 paragraphs, which is a smaller pile of reading and still a pile of reading. Nothing sorts, nothing ranks, nothing tells you which four calls deserve the afternoon.
What makes scale useful is uniformity. Ask every call the same question, get the answer back in the same shape, and the corpus becomes a dataset you can sort: every company that walked back full-year guidance, every call where analysts asked about pricing three or more times, every management team that stopped repeating a phrase they used last quarter. That is the difference between reading faster and covering more.
Step 1: acquire transcripts for the whole universe
The first constraint is coverage, not analysis. You need transcripts for every name in the universe, not just the large caps that get written up, and you need them keyed to a ticker and a fiscal period so the run can be assembled and compared later. Transcript APIs cover this reasonably well for US listings; small caps and non-US names are where coverage thins out, and it is worth knowing that gap before you draw a conclusion about the cohort.
Two things to pin down at this stage: the fiscal-period label (calendar quarters and fiscal quarters diverge, and mixing them silently corrupts any year-over-year comparison) and the date the call actually happened, which you will want when you line the language up against the price reaction.
Step 2: split prepared remarks from Q&A
This is the step most ad-hoc attempts skip, and it costs them most of the signal. A call is two very different documents stapled together. Prepared remarks are drafted, reviewed by counsel, and rehearsed. Their tone is close to a controlled variable, and it is almost always positive. Q&A is live, on topics analysts choose, under follow-up pressure.
Run sentiment or tone over the whole transcript and you average the two together, which mostly measures how long the prepared section was. Score them separately and you get something more useful: the gap. A management team whose prepared remarks are as upbeat as ever while the Q&A turns hedged and repetitive is telling you something that neither number shows on its own. If you are choosing how to score tone in the first place, the tradeoffs between lexicon methods and models are covered in FinBERT vs Loughran-McDonald vs LLMs.
Step 3: extract a fixed set of fields from every call
Decide the fields before the run, not while reading. The list should be short enough that every call can answer it and specific enough that the answers are comparable. A workable starting set:
| Field | What you are actually asking |
|---|---|
| Guidance action | Raised, maintained, lowered, or withdrawn - and for which line, revenue or margin or both. |
| Analyst pressure topics | What the questions concentrated on. Three questions on the same cost line is a topic, not a coincidence. |
| Non-answers | Questions asked and deflected. The deflected ones are a better shortlist than the answered ones. |
| Demand and pricing language | What management said about volume, pricing power, and mix, in their words rather than a paraphrase. |
| Carryover from last quarter | Whether the thing they flagged last quarter got an update, got quieter, or disappeared. |
| Source quote | The exact sentence behind each extracted field, so verification takes seconds rather than a re-read. |
Constrain the values. "Raised / maintained / lowered / withdrawn / not discussed" is a field you can filter and count. "Management struck a cautious but constructive tone" is not. The last row matters more than it looks: an extracted claim with no quote attached is something you have to go find again, which puts the reading right back where it was.
Step 4: compare across companies and across quarters
With uniform fields, the two comparisons that pay off are the cross-section and the time series. Across companies in the same quarter you can see whether a cost complaint is company-specific or sector-wide, which is usually the first question worth asking about any single-name surprise. Across quarters for the same company you get the diff: what management stopped saying, which risk got a new qualifier, whether the topic analysts pressed on last quarter went away or intensified.
The quarter-over-quarter view is the same technique that works on filings, where changes in the text carry more information than the text itself. The filings version of this is in how to compare 10-K risk factors year over year, and running both together is stronger than either alone, because a call and a filing disagreeing about the same risk is a specific and checkable thing.
What breaks when you scale this by hand
- Prompt drift. Asking the model slightly different questions across a batch produces answers that cannot be compared. The extraction has to be identical for every transcript in the run.
- Ungrounded claims. Extraction without a required source quote produces confident summaries you cannot check, and the errors that matter are exactly the ones that read fluently.
- Fiscal-period mismatches. Comparing a fiscal Q3 against a calendar Q3 silently, across a cohort, produces conclusions that look clean and are wrong.
- Coverage gaps treated as absence. A missing transcript is not a company that said nothing. Track which names failed to return a transcript and keep them visible in the output.
- No rerun. A one-off script that ran once in October and cannot be run again in January is not a process. The point of the work is that next quarter costs almost nothing.
Running it as a pipeline
This is the workflow Cutonce is built for: a transcript node pulls calls for the universe, an AI node runs the same extraction against every one of them with the field list you defined, and the output lands as a table you can filter and send to a sheet, a Slack channel, or your own model via webhook. Because it is a saved pipeline rather than a session, next quarter is a rerun, and the results line up against the last one by construction.
The analyst work does not disappear, it moves. You stop spending the first week of earnings season deciding what to read and spend it on the twelve calls the run flagged, with the quotes already pulled. That is the actual claim: not that the analysis is automated, but that triage stops being guesswork. On model choice for the extraction step, see which AI is best for equity research.
Note: this is not investment advice. Extraction at scale produces a shortlist, not a conclusion, and models do misread transcripts - keep the source quote next to every claim and verify anything you act on against the company's own transcript and filings.
Frequently asked
How do I analyze hundreds of earnings call transcripts at once? Treat it as a pipeline rather than a reading task: pull transcripts for the whole universe from a transcript source, split each call into prepared remarks and Q&A, run the same fixed extraction over every transcript so each one returns the same fields, then compare the results across companies and quarters. The point is uniformity - the same question asked of every call - because that is what makes the output rankable instead of just readable.
Should prepared remarks and Q&A be analyzed separately? Yes. Prepared remarks are written, lawyered, and rehearsed, so their tone is close to a controlled variable. Q&A is answered live under pressure from analysts who choose the topics. Scoring them together averages away the difference. Scoring them separately lets you look at the gap, which is often more informative than either number alone.
What should you extract from an earnings call transcript? A fixed set of fields you can compare: guidance direction and any changes to it, the topics analysts pressed on, questions that were asked but not answered, demand and pricing commentary, cost and margin commentary, and the language used around anything the company flagged last quarter. Define the field list before the run, not while reading.
Can AI read earnings calls reliably enough to screen on? For extraction against a defined question it is reliable enough to produce a shortlist, which is the job. It is not reliable enough to be the final read. The practical pattern is to use the model to narrow a universe down to the calls that warrant your attention and to always keep the source quote next to every extracted claim so you can verify it in seconds.