Extracting structured data from earnings calls: the pipeline and the table it returns
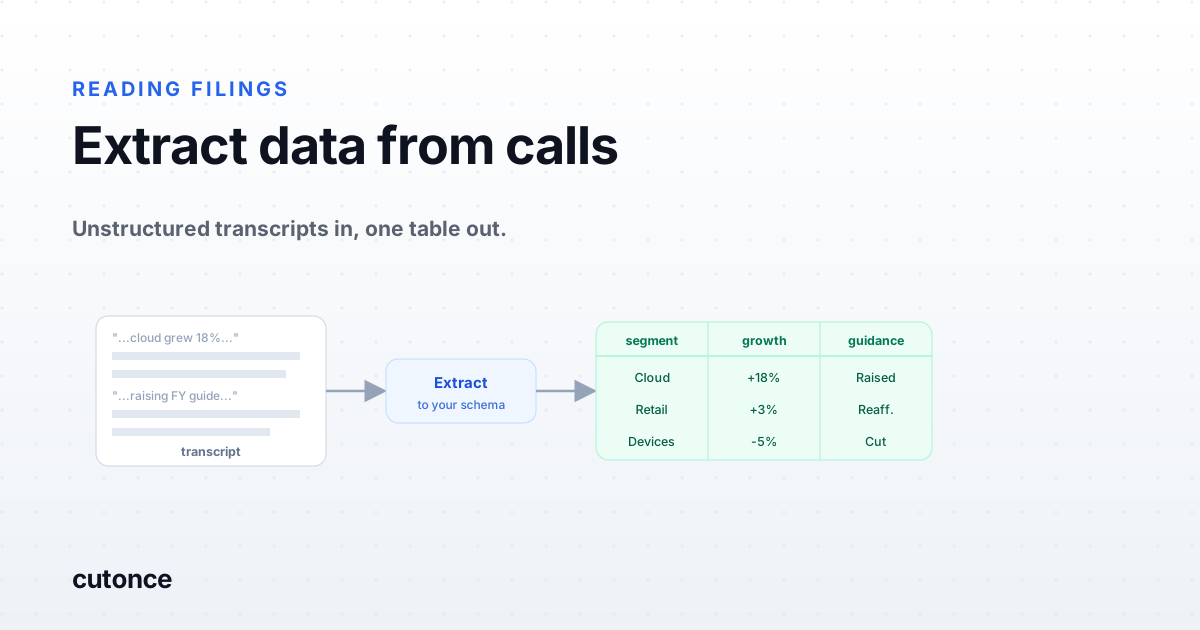
- The data you want from an earnings call already exists in the transcript - it is just unstructured, and it sits in a different place in every company's call. Extracting it by hand does not scale past a handful of names.
- Defining the schema is the actual work. You specify the exact fields to pull - raised or reaffirmed guidance, a segment's revenue growth, a specific KPI like same-store sales or net interest margin - and the pipeline returns those fields, the same way, for every transcript.
- Every extracted cell carries the sentence it was pulled from. That turns the output from a set of numbers you have to trust into a dataset you can audit, because each figure links back to where management said it.
- The result is a structured table across a universe of calls - sortable, filterable, and ready to feed into your own model - not a filtered shortlist. This is the extraction step; screening and ranking come after.
Say you want one thing from this quarter's calls: how each company's largest segment grew, in management's own words, and whether they raised or held guidance. For one company that is a five-minute read. For the two hundred names you follow it is a week you do not have, because the numbers are scattered - the segment figure shows up in the prepared remarks for one company and only in the Q&A for another, phrased differently each time. The data is all there. It is just not in a table.
That is an extraction problem, and it is separate from screening. A screener filters a universe down to a shortlist; extraction turns each call into structured fields so you have a dataset to screen, sort, or model on in the first place. This is a build log for the extraction pipeline - the one that takes a few hundred transcripts and returns a single table, with every cell carrying the sentence it came from.
The problem: the data is there, just not in a table
A transcript is forty-odd pages of unstructured text, and the useful numbers do not sit in fixed places. Company A gives segment growth in the CFO's prepared remarks; Company B only reveals it when an analyst presses in the Q&A; Company C quotes it year-over-year while Company D quotes it sequentially. A human reads around that inconsistency without thinking. A naive keyword search drowns in it. What you want is to define the fields once and have them filled in the same way for every call, so that at the end you have rows and columns, not four hundred pages.
The pipeline, node by node
Five nodes. The extract node in the middle is the one doing the real work; the validate node after it is what keeps the table from quietly filling with mismatched units.
| Node | What it does | What it emits |
|---|---|---|
| 1. Universe | The tickers I want data for - a watchlist, a sector, or a screen's output. | Tickers |
| 2. Transcript fetch | Pulls the latest earnings call transcript for each name that reported. | Ticker + transcript |
| 3. Extract to schema | Fills in the fields I defined for each transcript, with the source sentence for each. | Structured fields + quotes |
| 4. Validate + normalize | Checks units and formats, flags missing or ambiguous fields, puts figures on a common basis where it can. | Clean, comparable rows |
| 5. Output | Writes the table to a sheet, a database, or a downstream model. | One dataset, all names |
Note what is not here: there is no filter or scoring node. This pipeline does not decide which names are interesting - it structures all of them. The judgment happens after, once you have a table to reason over.
Defining the schema is the whole job
The extract node is only as good as the schema you hand it, and writing that schema is where your research question actually lives. You are not asking the model "what stood out" - you are telling it exactly what to pull. For the example above the schema might be:
- Largest segment - name of the biggest reported segment.
- Segment growth - its revenue growth, with the basis (year-over-year or sequential) captured explicitly so the column is comparable.
- Guidance action - raised, reaffirmed, cut, or withdrawn.
- Guidance figure - the new range or number, if given.
- Source quote - the sentence each of the above came from.
Because the schema is fixed, the output is comparable across all four hundred calls - the same columns, filled the same way, whether the company buried the number in the Q&A or led with it. And because every field carries its quote, the table is auditable: a figure you doubt links straight to what management said. This is the same discipline behind the earnings-transcript screener - scope the model to a narrow, checkable extraction rather than an opinion - applied to build a dataset instead of a shortlist. The longer argument for that approach is in analyzing earnings call transcripts at scale.
The output
Here is the shape of the table. Each row is one company's call, reduced to the fields I asked for. In practice a source-quote column sits alongside each figure; it is omitted here only for width.
Illustrative output - representative of the format, not a live run and not a recommendation. Tickers are used only to show the layout.
| Ticker | Largest segment | Segment growth | Guidance | New figure |
|---|---|---|---|---|
| Example A | Cloud | +18% YoY | Raised | FY rev $4.2-4.3B |
| Example B | Retail | +3% YoY | Reaffirmed | - |
| Example C | Devices | -5% YoY | Cut | FY EPS $2.10-2.20 |
| Example D | Services | +2% QoQ | Withdrawn | - |
That is four calls turned into four rows. Multiply it by the universe and you have a dataset you can sort by segment growth, filter to only the raised guides, or drop straight into a model - work that was not possible while the same facts sat as prose in four hundred separate transcripts.
Reading it, and the caveats
The table is a faithful record of what was said, which is not always the final filed number. Management frames, rounds, and occasionally quotes a figure that the release states differently, so the extracted values are a starting point to verify against the actual filing, not a substitute for it - which is why the source quote travels with every cell. Normalization is also imperfect: putting a year-over-year figure and a sequential one on a truly common basis is not always possible, so the pipeline captures the basis rather than silently blending them. The honest version of this output tells you what it is unsure about instead of papering over it.
Build it yourself, then build on top of it
Start with the schema - decide the exact fields your question needs, and be specific about units and basis, because vague fields produce a messy table. From there the extracted dataset is a foundation, not an endpoint: screen it for the names that raised guidance and beat, feed it into a valuation model through an output node, or track a KPI across quarters by running the same schema each season. Because the fields and their sources sit on the canvas, the dataset is reproducible - run it next quarter and you get the same columns, comparable to this one.
That is the extraction pipeline. It does not tell me which company looks best. It takes a few hundred calls I could never read in a morning and returns one table I can - with a quote behind every number.
Note: this is not investment advice. Extracted figures reflect what was said on a call and should be verified against the company's filed results before you rely on them. A structured dataset is a research input, not a conclusion.
Frequently asked
What does it mean to extract data from an earnings call? It means turning the unstructured spoken content of an earnings call transcript into structured fields - specific numbers and statements placed into named columns. Instead of reading forty pages to find a segment's growth rate or a revised guidance figure, you define those as fields and get them returned in a table, the same shape for every company, so the calls become a dataset you can sort, filter, and analyze.
How is extraction different from earnings call sentiment or screening? Sentiment scores the tone of a call; a screener filters a universe down to a shortlist that meets criteria. Extraction is the step underneath both - it pulls specific, named data points out of each transcript into a structured table. You can then screen or score on top of that table, but extraction itself does not filter or judge; it structures.
How do you keep extracted numbers trustworthy? Two ways. First, the extraction is scoped to a fixed schema you define, so the pipeline pulls the same named fields from every call rather than deciding what is interesting. Second, each extracted value carries the exact sentence it came from, so any figure can be checked against the transcript in seconds - and against the filed release, since what management says on a call is not always the final reported number.
Can I feed the extracted data into my own model? Yes - that is the point of structuring it. Once the calls are a table with consistent columns, the output can flow into a spreadsheet, a database, or your own valuation or scoring model through an output node, the same as any other structured dataset. Extraction is what makes downstream automation possible.