The earnings-transcript AI screener I run overnight, and the output it hands me
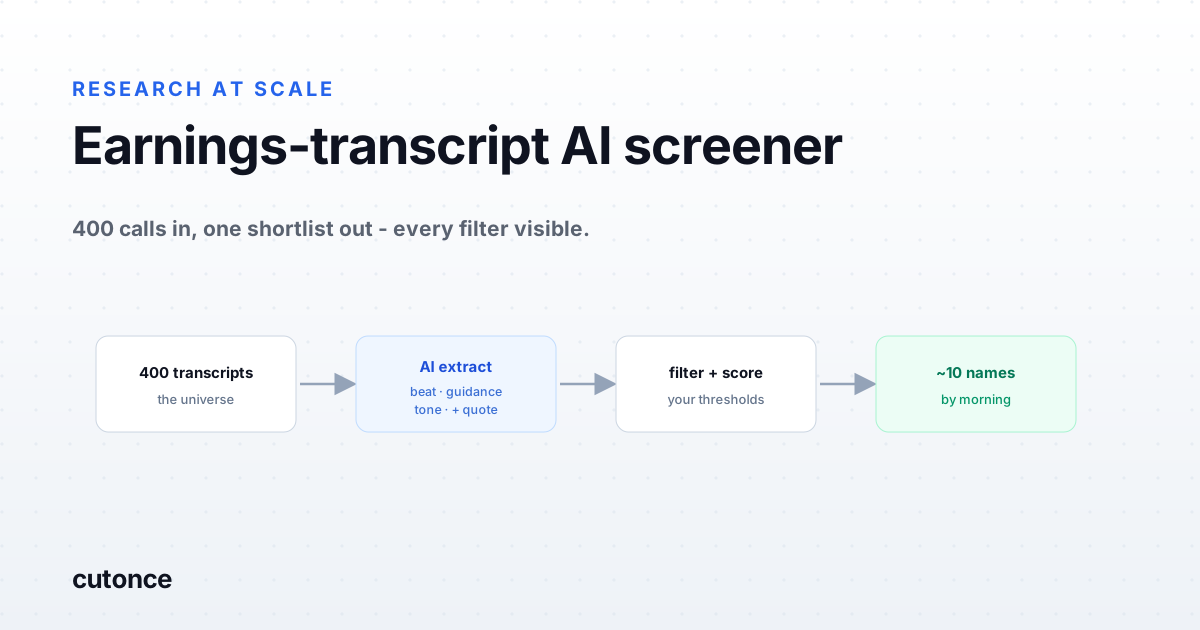
- The mechanical part of reading earnings calls - who beat, which way guidance moved, what tone the call carried - is a filtering problem, not a judgment problem. A pipeline can do it overnight and leave you the judgment.
- The value is not that AI reads the call. It is that the pipeline is reproducible and inspectable: you set every threshold, and each row on the shortlist carries the quote and the numbers it surfaced on, so you can check the work instead of trusting a score.
- The AI node returns structured fields - beat or miss versus consensus, guidance direction, a handful of tone and disclosure flags - plus the sentence it pulled each one from. That is what makes the output auditable rather than a black box.
- The output is a shortlist, not a buy list. It tells you which ten names out of four hundred are worth opening the transcript on this morning, and why each one surfaced.
Earnings season has a timing problem. Transcripts land after the close, in a rush, a few hundred across the names you follow in a heavy week. By the time you have read twenty of them the useful window is closing. The reading itself is not the hard part - the hard part is that there is too much of it to get through before the market opens, so you end up covering the names you already had an opinion on and missing the ones you did not.
Most of what you are doing on that first read is mechanical: did they beat, which way did guidance move, did management sound confident or hedged, did anything unusual get disclosed. That is filtering, not judgment. So I moved it into a pipeline that runs overnight and leaves a short list on my desk by morning. This is a build log for that pipeline - every node, what the AI node actually pulls out, and the shape of the output. Nothing here is hidden behind a model you cannot see into.
Why a pipeline instead of a black box
The reason to build this as a visible pipeline rather than hand the whole job to a model and ask "what looks good" is the same reason finance people are right to be skeptical of AI screens: a single number out of a model you cannot inspect is not research, it is a guess with a confident font. A pipeline fixes both halves of that. The filters are yours and they sit on the canvas where you can read them, so the logic that produced the list is not a mystery. And the model is scoped to a narrow, checkable job - extract these fields from this transcript - rather than asked to have an opinion. When the output is wrong you can see exactly which node was wrong, which is the whole point.
The pipeline, node by node
Six nodes, chained left to right. Each one takes the rows from the last and either enriches them or drops the ones that do not qualify.
| Node | What it does | What it emits |
|---|---|---|
| 1. Universe | The list of tickers I cover - an index, a watchlist, or a prior screen's output. | ~400 tickers |
| 2. Transcript fetch | Pulls the latest earnings call transcript for each ticker that reported in the window. | Ticker + raw transcript |
| 3. AI extract | Reads each transcript and returns a fixed set of structured fields, each with the sentence it came from. | Beat/miss, guidance, tone flags, quotes |
| 4. Consensus join | Joins the reported numbers against the consensus estimate to confirm the beat or miss and its size. | Surprise %, direction |
| 5. Filter + score | Keeps only rows that clear my thresholds, then ranks what is left. | Shortlist, ranked |
| 6. Output | Writes the shortlist to a table and emails it to me before the open. | ~10 names + why |
The counts matter: the universe is four hundred names, the shortlist is about ten. The pipeline's job is to throw away three hundred and ninety transcripts I do not need to open, and to be able to tell me why it kept the ten it did.
What the AI node actually extracts
This is the node people mean when they say "AI screener," so it is worth being concrete about what it does and does not do. It does not rate the company. It reads one transcript and fills in a fixed schema - the same fields every time - so the results are comparable across four hundred calls:
- Result vs consensus. Did revenue and EPS beat, miss, or meet, and roughly by how much, as stated on the call. (Confirmed independently in the consensus-join node.)
- Guidance direction. Raised, reaffirmed, cut, or withdrawn - and for which line.
- Tone flags. A short, fixed list: hedging language, unusual defensiveness, first-time mention of a headwind, heavy analyst push-back on one topic.
- Disclosure flags. Going-concern language, a change in a key metric definition, an auditor or restatement mention, a large one-time item.
- The quote. For every flag above, the exact sentence from the transcript it was pulled from.
That last field is the one that keeps this honest. A flag that says "guidance raised" with no source is a claim you have to trust. The same flag with the sentence attached is evidence you can check in five seconds. If you want the longer argument for scoping the model to extraction rather than opinion, it is in how to analyze earnings call transcripts at scale.
The output
Here is the shape of what lands in my inbox. The columns are the fields the pipeline can defend; the last one is the plain-language reason the row cleared the filter.
Illustrative output - representative of the format, not a live run and not a recommendation. Tickers are used only to show the layout.
| Ticker | Rev vs cons. | Guidance | Flag | Why it surfaced |
|---|---|---|---|---|
| Example A | +4.1% | Raised FY rev | - | Beat and raise, no hedging in Q&A |
| Example B | +0.6% | Reaffirmed | First mention: pricing pressure | Thin beat, new headwind language |
| Example C | -2.3% | Cut FY EPS | Heavy analyst push-back | Miss plus cut, defensive tone |
| Example D | +7.8% | Raised, margin | - | Large beat, margin guide up |
| Example E | +1.2% | Withdrawn | Metric definition changed | Guidance pulled, disclosure flag |
Notice the list is not "the five best stocks." It is a mix - clean beats, thin beats with a new worry, a miss worth understanding, a withdrawn guide. The pipeline is not telling me which to buy; it is telling me these are the five transcripts, out of four hundred, that changed something. That is the job.
How I read the shortlist
The output is a starting point and I treat it like one. For each row I open the transcript at the quoted sentence and read around it - the flag tells me where to look, not what to conclude. A "first mention: pricing pressure" flag on a thin beat is exactly the kind of thing that never shows up in the headline number and is the reason to run the screen at all, but whether it matters is a judgment the pipeline does not make and should not. Numbers stated on a call also get verified against the actual release; management's framing and the filed figures are not always the same thing, which is its own reason to keep a human in the loop.
Build it yourself
The thresholds are the part you own, and they are where your view of the market lives. Mine are roughly: keep any beat or miss above a surprise threshold, keep every guidance change regardless of the beat, and keep anything that trips a disclosure flag even if the quarter looked fine. You might weight tone more heavily, or narrow the universe to a sector you know cold, or add a price-reaction node so you only see names where the market has not already moved. The point is that these choices are explicit and sit on the canvas, so six months from now you can see exactly why a name did or did not make the cut - and change it.
That is the pipeline I run during earnings season. It does not read the calls better than I would. It reads all of them, overnight, and hands me the ten that are worth my morning - with the receipts attached.
Note: this is not investment advice. The output of a screen is a research starting point, not a thesis or a recommendation. Extracted figures should be verified against the company's filed results and the full transcript before you act on them.
Frequently asked
What is an earnings transcript AI screener? It is a pipeline that pulls earnings call transcripts across a universe of companies, uses a language model to extract structured facts from each one - beat or miss versus consensus, guidance direction, tone and disclosure flags - and then filters and ranks the results into a shortlist. The AI does the reading; the screener does the filtering; you do the judgment.
How is this different from just asking ChatGPT to read a transcript? Asking a chatbot about one transcript is a manual, one-off lookup. A screener runs the same extraction over every call in your universe on a schedule, applies thresholds you define, and returns a ranked list with the source quote attached to each field. It is reproducible and inspectable across hundreds of names, not a single answer you have to take on faith.
Does the AI decide what to buy? No. The pipeline extracts facts and filters on them - it never forms a thesis. A name surfaces because it met your criteria (say, a revenue beat plus raised guidance plus no going-concern language), and every surfaced field links back to the sentence it came from so you can verify it against the transcript before you act.
How do you keep the output from being a black box? Two ways. First, every filter and threshold is set by you and visible on the canvas, so the logic that produced the list is not hidden. Second, each extracted field carries the quote it was pulled from, so a claim like 'guidance raised' shows the exact sentence. You are reviewing evidence, not trusting a score.