The REIT dividend-safety screen I run on AFFO payout, not EPS payout
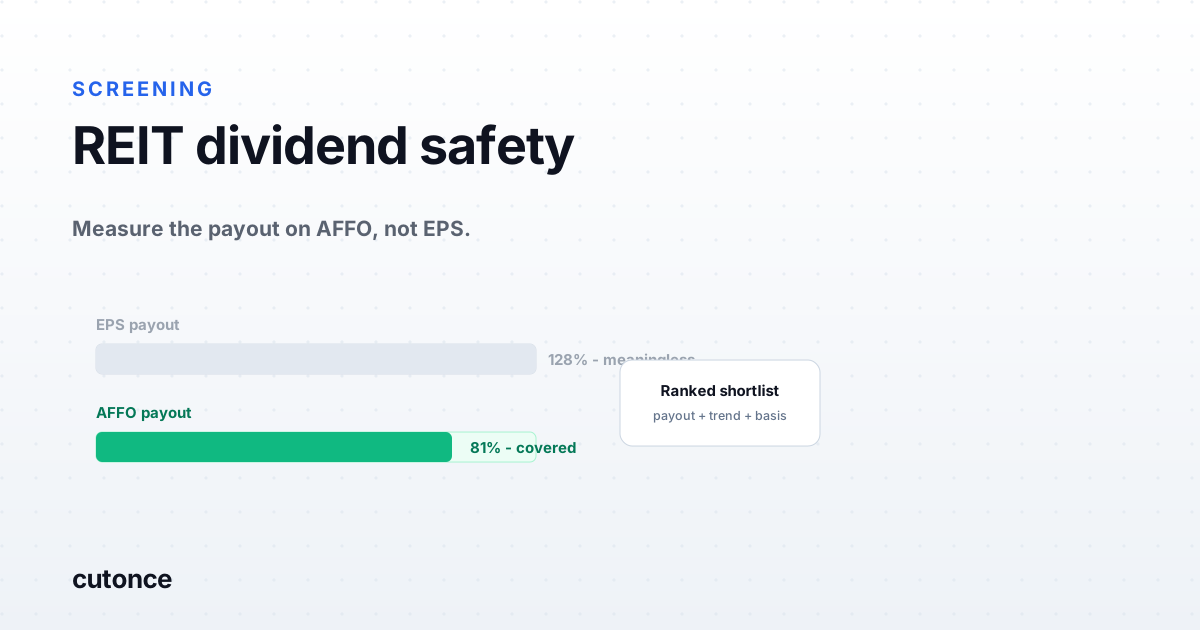
- The EPS payout ratio is the wrong tool for a REIT. Real-estate depreciation is a large non-cash charge that pushes GAAP earnings far below the cash a REIT actually generates, so a payout ratio built on EPS routinely reads above 100% for healthy names and tells you nothing.
- The denominator that measures dividend safety for a REIT is AFFO - funds from operations adjusted for recurring capital spending. Screening on the AFFO payout ratio, and its trend, is what separates a covered dividend from one being funded by something other than operations.
- AFFO is a non-GAAP figure each REIT defines slightly differently, so the pipeline records the definition and source alongside the number. That is what keeps the screen honest rather than comparing figures that are not the same thing.
- The output is a ranked view of a REIT universe by AFFO payout and coverage trend - a shortlist of names where the dividend math is tightening, to investigate, not a verdict on the dividend.
Run a normal dividend-safety screen over a basket of REITs and the output is nonsense. Half the list shows a payout ratio above 100%, which on any other sector would mean the company is paying out more than it earns and the dividend is in danger. For REITs it usually means nothing of the sort. The screen is using the wrong number.
The reason is depreciation. A REIT owns buildings, and GAAP makes it depreciate them on a schedule even as the properties hold or gain value. That depreciation is a large non-cash charge that drags reported earnings far below the cash the REIT actually collects in rent. So EPS is a poor proxy for distributable cash, and a payout ratio built on it is measuring an accounting convention. The number that actually tracks dividend safety for a REIT is AFFO. This is a build log for the screen I run to rank a REIT universe on AFFO payout instead - every node, and the output it leaves me.
Why EPS payout is the wrong number for REITs
The chain from earnings to distributable cash runs through two steps the rest of the market does not need:
- FFO (funds from operations) takes net income and adds back real-estate depreciation, then strips out gains on property sales. It is the industry's answer to "what did operations actually produce," and it has a broadly common definition.
- AFFO (adjusted FFO) goes one step further and subtracts the recurring capital spending a REIT must make to keep its properties earning - maintenance, leasing costs, tenant improvements - plus other normalizing adjustments. It is the closest single figure to the recurring cash a REIT can safely pay out.
Dividends over EPS answers a question that does not apply here. Dividends over AFFO answers the one that does: is the payout covered by recurring cash, and by how much. A REIT at a 75% AFFO payout has real cushion; one at 95% and climbing is running the tank low, regardless of what its EPS payout says.
The pipeline, node by node
Six nodes. The screen is only useful if every REIT's payout is computed on a comparable basis, so a normalize step sits in the middle where a naive screen would not have one.
| Node | What it does | What it emits |
|---|---|---|
| 1. Universe | The REIT universe I cover - an index, a sector list, or a prior screen's output. | REIT tickers |
| 2. Cash-flow pull | Pulls FFO or AFFO per share and the definition/source for each name. | AFFO + its basis |
| 3. Dividend pull | Pulls the current declared dividend per share. | Dividend/share |
| 4. Payout + trend | Computes the AFFO payout ratio and its trend across recent quarters. | Payout %, direction |
| 5. Filter + flag | Keeps names above a payout threshold or with a deteriorating trend; flags why. | At-risk shortlist |
| 6. Output | Ranks the shortlist and writes it to a table with each name's AFFO basis. | Ranked names + basis |
Node two carrying the AFFO basis alongside the number is the part that keeps this defensible, and it is covered next.
The catch: AFFO is not standardized
FFO has a common definition. AFFO does not - it is non-GAAP, and each REIT decides which capital expenditures count as recurring, how to treat straight-line rent, how to handle stock compensation. Two REITs reporting the same AFFO payout may have calculated AFFO on genuinely different bases, and a screen that ignores this is ranking numbers that are not comparable. So the pipeline records each REIT's AFFO definition and source with the figure, and where a name only reports FFO, it flags that the payout is on the looser measure. You are not forced to trust a single blended number; you can see what went into it. That transparency is the whole reason to build this as an inspectable pipeline rather than pull a pre-computed "payout ratio" field and hope it means what you think.
The output
Here is the shape of the ranked view. It sorts by payout and surfaces the trend, because a high payout that is stable reads differently from a merely elevated one that is climbing.
Illustrative output - representative of the format, not a live run and not a recommendation. Tickers are used only to show the layout.
| Ticker | AFFO payout | Trend (4q) | Basis | Why it surfaced |
|---|---|---|---|---|
| Example A | 96% | Rising | AFFO (reported) | High payout, deteriorating coverage |
| Example B | 91% | Flat | AFFO (reported) | Elevated but stable - watch |
| Example C | 88% | Rising | FFO only | On looser measure; true AFFO likely higher |
| Example D | 82% | Rising | AFFO (reported) | Comfortable level, but trend turning |
The list is not "REITs about to cut." It is the names where the cash math behind the dividend is tight or tightening, ranked so the most stretched sit at the top - and Example C carries a flag that its payout is on FFO, not AFFO, so its real coverage is likely thinner than the number shows. That flag is the difference between a screen that informs and one that misleads.
Reading it, and the caveats
A high AFFO payout is a reason to look, not a conclusion. A REIT can carry a 95% payout for years if its cash flows are steady and its balance sheet is sound; another at 85% can be in trouble if a big lease is rolling or debt is repricing. The screen points you at the names to open the filings on - to read the lease maturities, the debt schedule, and the guidance - not at names to act on. And because AFFO is self-defined, the single most important habit is checking how each REIT computes it before comparing two payouts side by side. The pipeline gives you the basis; the judgment is still yours.
Build it yourself
The thresholds are where your view goes in. Mine flag any AFFO payout above a level I treat as stretched, plus anything with a rising trend over the last several quarters even if the level still looks fine - because the trend is usually the earlier signal. You might add a debt-maturity node so a tightening payout and a wall of near-term refinancing surface together, or split the universe by property type, since a 90% payout means something different for a triple-net lessor than for a hotel REIT. Whatever you choose, the logic sits on the canvas, so the ranking is never a black-box "safety score" - it is dividends over a cash measure you can inspect, on a basis you can read.
That is the screen. It does not tell me which dividends are safe. It ranks a REIT universe on the number that actually measures coverage, flags where that number was calculated on a looser basis, and hands me the handful of names where the math is worth a closer look.
Note: this is not investment advice. Dividend-safety metrics are one input among many - balance sheet, lease terms, and sector conditions all matter - and AFFO is a non-GAAP figure that varies by issuer. Verify each REIT's AFFO definition and figures against its filings before drawing conclusions.
Frequently asked
Why is the EPS payout ratio wrong for REITs? REITs carry large non-cash depreciation charges on their properties, which drives GAAP net income - and therefore EPS - well below the actual cash the business produces. A payout ratio of dividends over EPS then looks alarmingly high, often above 100%, even for a REIT comfortably covering its dividend from cash flow. The ratio is measuring an accounting artifact, not dividend safety.
What is the AFFO payout ratio? AFFO (adjusted funds from operations) starts from FFO - net income with real-estate depreciation and property gains removed - and then subtracts recurring capital expenditure and other normalizing items to approximate the recurring cash a REIT can actually distribute. The AFFO payout ratio is dividends divided by AFFO; the lower it is, the more cushion the dividend has. It is the standard cash-based coverage measure for REITs.
Is AFFO a standardized number? No. FFO has a common industry definition, but AFFO is non-GAAP and each REIT adjusts it differently - which capital expenditures count as recurring, how straight-line rent and stock compensation are treated. That is exactly why a screen should record each REIT's AFFO definition and source alongside the figure, so you are not ranking numbers that were calculated on different bases.
How do you screen a whole REIT universe for dividend safety? You pull FFO or AFFO and the dividend per share for every REIT in the universe, compute the AFFO payout ratio, and look at both its level and its trend over recent quarters. Names where the payout is high and rising are where the dividend math is tightening. Doing this across a universe and over time is a pipeline job, not a name-by-name one.