How to screen a 10-K for red flags
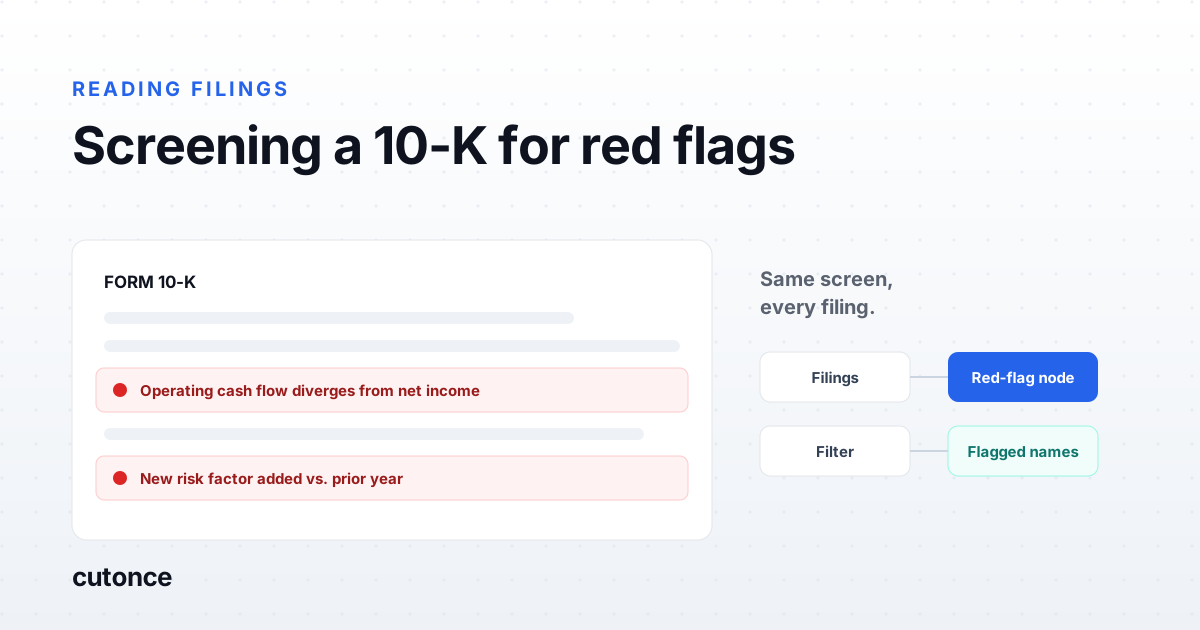
- The dangerous red flags are almost never in the income statement. They live in the notes, the MD&A, the risk factors, and the parts of the cash flow statement nobody reads closely - which is exactly why they survive to become surprises.
- Read a 10-K in a fixed order and against a fixed checklist. Consistency is what turns a vague sense of unease into a repeatable signal you can compare across names and across years.
- The highest-value reads are comparative: this year's risk factors against last year's, cash flow against reported earnings, and management's tone against the numbers it is describing.
- One 10-K is a reading exercise. A coverage universe is a workflow problem - you want the same red-flag criteria applied to every filing automatically, with an audit trail, not a stack of PDFs you skim by hand.
Most red flags in a 10-K are not hidden. They are just boring, buried in the parts of the filing that do not photograph well - the notes, the MD&A, the reconciliation lines on the cash flow statement. The number that blows up a position next quarter was usually sitting in this quarter's filing in plain, dull language. The job is not detective work; it is reading the right sections, in the right order, against the same checklist every time. Here is the one I use.
What counts as a red flag, really?
A red flag is not "bad news." Bad news is priced. A red flag is a divergence- a place where two things that should agree do not. Earnings rise but cash does not. The story in the MD&A is confident but the risk factors quietly grew a paragraph. Revenue is flat but receivables ballooned. None of these is proof of anything on its own. Each is a question the filing is asking you to answer before you size a position.
That framing matters because it tells you where to look. Divergences do not show up in a single headline figure. They show up when you put two numbers next to each other, or this year's language next to last year's.
Where the red flags actually hide
Read the filing in this order. It is roughly reverse-glossy: start where management has the least room to shape the narrative and work toward where it has the most.
| Section | What to check | The divergence it exposes |
|---|---|---|
| Cash flow statement | Operating cash flow vs. net income; capitalized costs; one-off working-capital swings | Earnings that are not backed by cash |
| Notes to financials | Revenue recognition, accounting-policy changes, off-balance-sheet items, related-party deals | Aggressive accounting dressed as routine |
| Risk factors (Item 1A) | New factors vs. last year; a specific risk moving higher; vaguer language | What management now worries about but will not say plainly |
| MD&A | Non-GAAP adjustments, tone vs. numbers, "challenging environment" hedging | Story that runs ahead of the results |
| Legal & commitments | New litigation, guarantees, contingent liabilities, covenant terms | Obligations the balance sheet understates |
| Auditor / controls | Change of auditor, material-weakness disclosures, restatements | The financials themselves may not be reliable |
Notice the income statement is not on the list as a starting point. It is the most managed page in the document. You reconcile to it, from the cash flow statement and notes - you do not start from it and trust your way down.
A checklist you can run the same way every time
The value of a checklist is not that any single item is clever. It is that you apply all of them, in the same way, to every name - so a flag on one company means the same thing as a flag on another. Mine, in short:
- Cash vs. earnings. Is operating cash flow tracking net income over three years, or drifting below it? Persistent divergence is the single most reliable accounting warning.
- Accruals. Are earnings increasingly made of accruals rather than cash? Rising total accruals relative to assets is the input behind the Sloan accrual anomaly and the Beneish M-Score for a reason.
- Receivables and inventory. Are days-sales-outstanding or days-inventory rising faster than revenue? That is channel-stuffing or demand softening, in advance.
- Risk-factor diff. What is new or reworded in Item 1A versus last year's 10-K? Companies add risk-factor language when their lawyers see something coming.
- Non-GAAP distance. How far is adjusted EBITDA from GAAP, and is that gap widening? Persistent, growing add-backs are a story about what management wants you to ignore.
- Auditor and controls. Any change of auditor, material weakness, or restatement is a stop-and-read-everything event, not a footnote.
- Related parties and off-balance-sheet. Deals with insiders and entities that keep obligations off the balance sheet are where the most damaging surprises historically start.
The flags you can only see across filings
The strongest signals are comparative, and a single 10-K cannot give them to you. Risk factors are only interesting against last year's. An accrual ratio is only interesting as a three-year trend. A management team that has quietly walked back a growth claim for three straight years is telling you something no single filing states. This is the work that rewards reading the same company across time - and reading a whole peer group the same way, so an unusual figure stands out as unusual.
It is also the work that does not scale by hand. Diffing risk factors across two years for one company is an afternoon. Doing it for a coverage list of eighty names, every quarter, is not something you do twice.
Doing this across a universe, not one filing at a time
Here is where the exercise stops being a reading habit and becomes a workflow. The mechanical parts of this checklist - pull the filing, extract the cash-flow and accrual figures, diff the risk factors against last year, flag the divergences - are exactly the parts that reward automation, because they are identical for every name and tedious enough that you skip them under time pressure.
That is the gap Cutonce is built to close. You define the red-flag criteria once - the cash-to-earnings test, the accrual threshold, the risk-factor diff, an AI node reading the MD&A for hedging language - and run the same screen across every filing in your universe, with the inputs and outputs recorded for each name. The point is not that the tool decides what is a red flag. You decide that. The tool just means you never again miss one because it was on page 94 of the eleventh filing you did not have time to open.
Note: none of this is investment advice, and no single red flag is a thesis. Divergences are prompts to investigate, not conclusions. Always read the underlying filing before acting, and treat any figure pulled by a tool - or by an AI - as a claim to verify against the primary source.
Frequently asked
What are the biggest red flags in a 10-K? Earnings that grow while operating cash flow does not, rising days-sales-outstanding, new or vaguer risk factors versus last year, changes in auditor or accounting policy, heavy use of non-GAAP adjustments, and related-party transactions. The pattern that matters most is a gap between the story management tells and what the cash flow statement and notes actually show.
Which section of the 10-K should I read first for red flags? Start with the cash flow statement and reconcile it to reported net income, then read the MD&A and the risk factors (Item 1A), then the notes. The headline income statement is the most managed part of the filing, so it is the least useful place to look for problems.
Can you automate screening 10-Ks for red flags? Yes. The mechanical parts - pulling the filing, extracting figures, comparing risk factors year over year, flagging accruals or cash-flow divergence - are well suited to a repeatable pipeline that applies the same criteria to every name. The judgment about what a flag means still belongs to the analyst.